The Importance of Construction to State Economies: 2015 GDP Update
By Dr. Bernard M. Markstein, president and chief economist of Markstein Advisors, August, 2016
This article is an update to The Importance of Construction to State Economies and Private Construction Industry’s Importance to State Economies with 2015 data.
Background on Construction and the Economy
Construction has always played a vital role in the nation’s economy despite some ups and downs. From 1999 through 2015, real (inflation-adjusted) construction investment (both residential and nonresidential) varied from 5.1 percent of real gross domestic product (GDP) in 2010 and 2011 to 9.4 percent of GDP in 1999. In 2014 and 2015, construction investment was 6 percent of GDP.
These numbers represent the direct impact of construction investment. However, there are additional benefits from purchases related to, but not directly included in, construction projects, such as equipment for a new factory, furniture for an office or residential property, and appliances for commercial and residential units. Further, the workers employed in construction stimulate other parts of the economy by spending their income. Based on reasonably conservative estimates, these additional purchases add at least 2 percent to 3 percent to the impact of construction activity on the economy.
The Bureau of Economic Analysis (BEA) produces estimates of the value added by construction to national and state GDP. The value-added measure excludes the value (cost) of materials used in a construction project, but does include the value of labor employed in construction. Purchased services such as communications, finance and insurance are excluded from the value-added measure, as is the value of the land on which a structure is built. Thus the value-added measure is smaller than the number used in the overall GDP accounts and for the ratios cited above, which is based on investment in new structures and improvements to older structures.
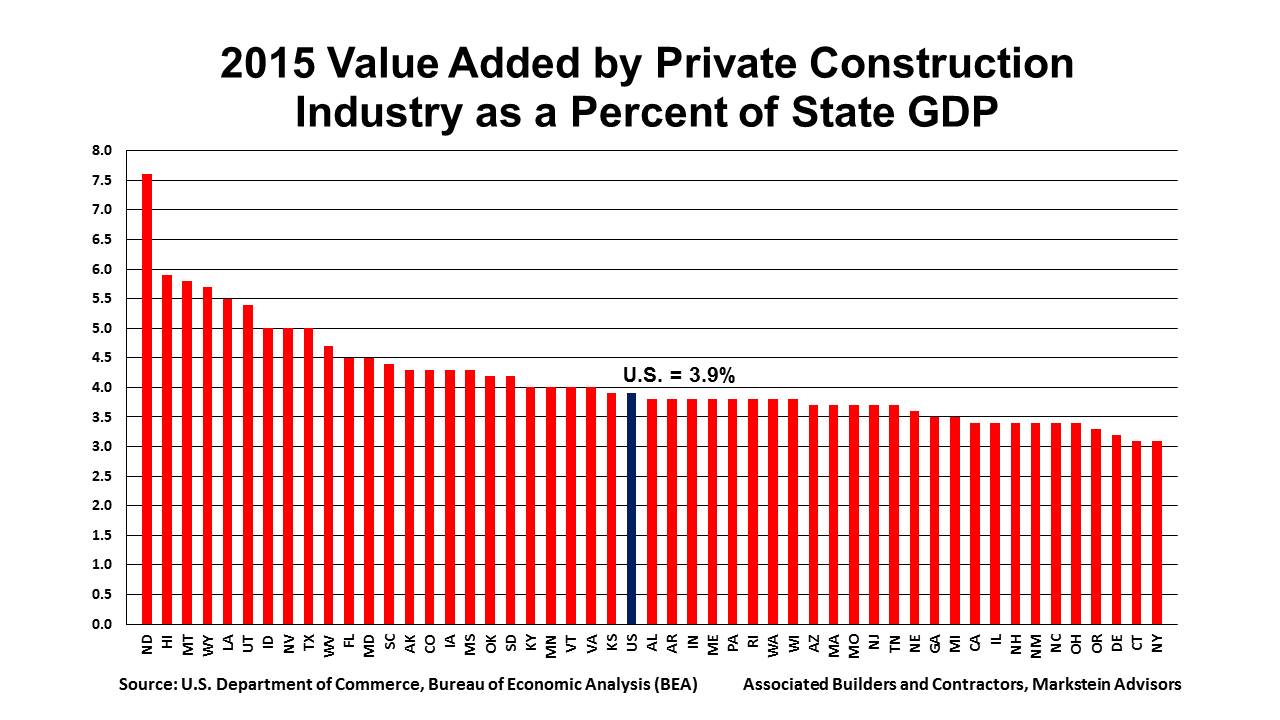
From 1997 to 2015, the value added by the private construction industry as a percentage of real (inflation-adjusted) GDP declined nationally from a high of 6.2 percent in 1997 and 1998 to a low of 3.7 percent in 2011. By 2015, the measure had risen to 3.9 percent, its highest level since 2009, when it was 4 percent.
Note the difference between the two measures—the contribution to the economy from construction investment and the more narrowly defined value-added number. The contribution from construction investment to the national economy is, on average, a little more than 50 percent greater than the more restrictive value-added measure of construction. The lower value-added number is used for state GDP to better capture construction-related activity within each state, since building materials and purchased services may originate in other states. For the portion of those items that do come from the same state, their value is assigned to the relevant (non-construction) industry. The value is captured in the state GDP number, but not in the state construction number.
View the breakdown of construction's contribution to GDP per state and states ranked by construction's contribution to their GDP in 2015.
Construction and State Economies
The relative impact of the value added by private construction on various state economies varies dramatically both among states in a particular year and within a state over time. As a percentage of state GDP, it has ranged from a high of 14.8 percent in Nevada in 1997 to a low of 2.9 percent in Connecticut in 2010 and New York in 2012. The variation in this ratio for a state over time can be dramatic, as demonstrated by Nevada, which had a peak of 14.8 percent in 1997 and dropped to a low of 4.5 percent in 2012.
An overview of the BEA’s Regional Economic Accounts can be found on page 19 of the BEA guide Measuring the Nation’s Economy. For a deeper dive into the methodology used in calculating state GDP and the value-added measure, see BEA’s Gross Domestic Product by State Estimation Methodology.
View a regional breakdown of construction's contribution to state economies.
2015 Compared to 2014
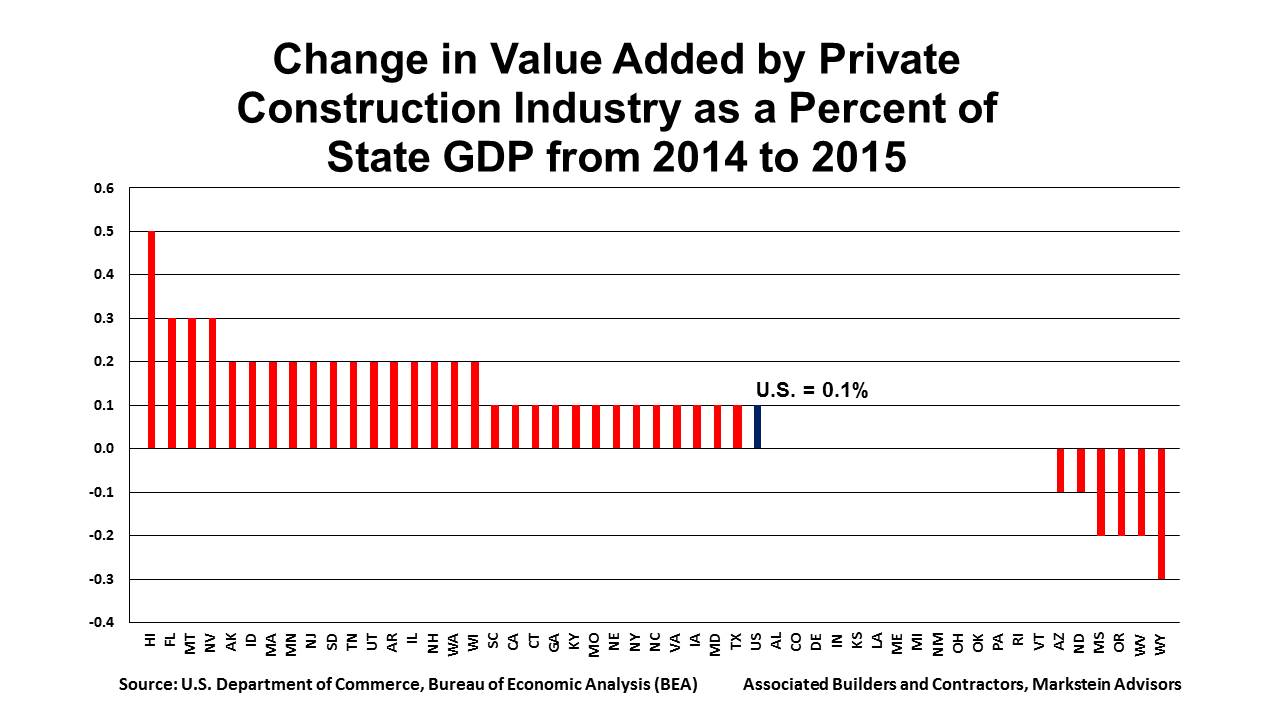
The contribution to national GDP increased by 0.1 percent between 2014 and 2015, from 3.8 percent to 3.9 percent. Among the states, 30 experienced an increase, 14 no change, and six a decrease. Hawaii had the greatest increase, jumping 0.5 percent from 5.4 percent to 5.9 percent. It was followed by Florida, Montana and Nevada each of which rose by 0.3 percent.
Wyoming’s share fell the most, down 0.3 percent, but it remained in the top five states for construction’s contribution to the state’s economy. The drop was most likely due to the downturn in oil and gas exploration and production due to lower prices.
View states ranked by their year-over-year change in construction's contribution to state GDP from 2014 to 2015.
Data Revisions
With the release of the 2015 annual data, the BEA revised the annual data for 2008 through 2014, incorporating both additional and revised state data. The national ratios did not change except in 2014 (previous revisions to the data were already incorporated into pre-2014 national data). However, state ratios did. This table shows the difference between the state ratios from 2008 through 2014 based on the 2016 data and the ratios based on the 2015 data.
North Dakota had the largest changes (revisions) in its ratio each year over this period, all upward revisions. Wyoming also had large upward revisions followed closely by West Virginia. Nebraska had the largest downward revisions in 2013 and 2014. From 2008 through 2012, Arizona had the largest downward revisions in its ratio. It was joined by Nebraska in 2010 (both down 0.5 percent) and New Mexico in 2008 (both down 0.3 percent).
Focusing on 2014 revisions, North Dakota’s ratio was revised up 1.8 percent from 5.9 percent to 7.7 percent. Right behind it were Wyoming (up 1 percent), West Virginia (up 0.9 percent) and Idaho (up 0.7 percent). These three states also moved up in the 2014 rankings of construction’s contribution to state economies—Wyoming to number two, West Virginia to seven and Idaho to nine.
Nebraska had the largest downward revision (down 0.7 percent). Next were Alaska, Arizona and Mississippi, all revised down 0.5 percent.
Top Five States in 2015
In 2015, the top five states for the value added from construction as a percentage of state GDP in order from highest to lowest were:
1. North Dakota
2. Hawaii
3. Montana
4. Wyoming
5. Louisiana
For North Dakota, the combination of a relative small economy (45th largest GDP in 2015 among the states) and the energy boom have contributed to its number-one rank as the state with the greatest percentage contribution from construction to state GDP from 2011 through 2015. North Dakota’s top ranking in 2015 at 7.6 percent was in spite of lower energy prices reducing exploration and drilling in the state. Both overall employment and employment in the oil fields fell in 2015, reducing the money flowing to some parts of North Dakota and the need to house workers.
Hawaii, which also has a relatively small economy (38th largest GDP in 2015), ranked second in construction’s contribution to the state’s economy at 5.9 percent. This was up from fifth highest in 2014 based on revised data (originally reported as tied for third). Hawaii has benefited from residential and tourism-related construction.
Montana had the third largest contribution from construction to its economy (5.8 percent) in 2015, a ranking it has held since 2012. Since the beginning of the data in 1997, the contribution from construction has never fallen below 5.5 percent. Montana is another state with a relatively small GDP, ranked 47th largest in 2015. Beyond agriculture, the state benefits from energy (coal and gas) and tourism.
Wyoming has the second smallest state economy but had the fourth biggest contribution to its economy from construction in 2015—5.7 percent. As with Montana, agriculture, energy and tourism are major drivers of the state economy. The downturn in energy is likely the source of Wyoming’s ranking slipping from second in 2012 through 2014 to fourth in 2015.
Louisiana’s rank fell to fifth largest contribution from construction (5.5 percent) from third largest in 2014 based on revised data. Louisiana’s economy falls among the middle of the states (24th largest). Tourism and energy are among the main drivers of its economy.
Although a relatively small state GDP helps a state’s ranking in its contribution from construction, a large state GDP does not preclude a state from benefiting from construction on a relative basis. Note that Texas, with the country’s second largest state GDP in 2015 after California, tied for seventh largest contribution from construction with Idaho and Nevada. And some states with relatively small state GDPs, such as Delaware and New Hampshire, rank low in their contribution from construction.
Bottom Four States
In 2015, the bottom four states for the value added from construction as a percentage of state GDP in order from highest to lowest were:
47. Oregon
48. Delaware
49. Connecticut and New York (tie)
The focus is on the bottom four rather than the bottom five since the fifth lowest was a tie at 3.4 percent among six states—California, Illinois, New Hampshire, New Mexico, North Carolina and Ohio. Note that among all of the states, none fell below 3 percent of state GDP, a reading suffered by Connecticut in 2010 and New York in 2012 (2.9 percent each).
The bottom two states, Connecticut and New York, at 3.1 percent, were less than a percentage point below the U.S. average of 3.9 percent. These two states also had the lowest share in 2013 and 2014 based on revised data. New York had the lowest share in 2012. In 2011, Connecticut and New York shared that ranking with Oregon, all at 3.0 percent.
New York, with the third largest state GDP in 2015, benefits from a number of industries. The New York City metropolitan area is still the financial center of the United States and, to a large extent, the world. The state has a large manufacturing sector, though some of that is old, declining manufacturing. Agriculture remains a major contributor to the state’s economy. The Empire State also benefits from tourism, with New York City, the Finger Lakes, the Adirondacks and Niagara Falls attracting numerous tourists.
Although there has been a bit of a building boom in Manhattan of primarily multifamily projects, overall construction in the state, while improving, was not that great in 2015. The New York City metropolitan area, particularly White Plains, suffered from overbuilding of single-family houses during the housing bubble a few years ago. Although metropolitan area home prices as measured by the S&P/Case-Shiller® Home Price Index have increased each month on a year-over-year basis beginning in January 2013, as of May 2016 they were still 16 percent below their peak in May 2006. This has held down overall residential construction in the area. Also, most expansion in the financial sector has occurred outside of the state with New Jersey being a primary beneficiary.
Connecticut’s state GDP placed it just above the middle in 2015 with the 23rd largest state economy. The state’s economy is strongly influenced by developments in the New York City metropolitan area. The interconnection between the two is recognized in the government’s definition of the Combined Statistical Area (CSA) for New York City.
CSAs capture economic and social interactions of larger areas that include one or more of the area’s Metropolitan Statistical Areas (MSAs). The New York City MSA includes several New York counties, part of northern New Jersey (the Newark area) and a small part of Pennsylvania (Pike County). The CSA adds in more of New York (Kingston MSA), more of New Jersey (such as the Trenton MSA), more of Pennsylvania (such as the Allentown MSA) and most of western Connecticut (the Bridgeport, New Haven and Torrington MSAs).
Many high income individuals who work in Manhattan live in Connecticut, particularly in the Bridgeport MSA. This has a large impact on residential construction in that area and on the state. Connecticut, of course, has its own industries, most notably insurance (still a major factor in the Hartford area) and manufacturing (largely driven by military contracts). Educational institutions from the University of Connecticut to Yale University provide some stability to the state’s economy and often have their own construction projects.
Delaware, although the second smallest state based on land area and the sixth smallest based on population, had the 41st largest GDP in 2015. However, construction’s contribution to state GDP was the third lowest percentage among the states (3.2 percent). Note that similarly sized Rhode Island ranked 25th highest in construction’s benefit to state GDP (3.8 percent), tied with several other states.
Delaware is another state whose economy is strongly affected by forces in a neighboring state—Pennsylvania. Delaware’s largest city, Wilmington, is part of the Philadelphia MSA. Delaware remains the state where most large corporations incorporate. Finance and insurance are major contributors to the state’s economy, as are—to a lesser extent—manufacturing and agriculture.
Oregon had the fourth lowest contribution to state GDP from construction (3.3 percent). The state is no longer dependent on just agriculture, natural resources and tourism, though these remain important (e.g., Oregon is still a major lumber producer), but has spread out to manufacturing and high tech.
Outlook for the Economy and Construction
The Great Recession in the United States ended in third quarter of 2009. From the recession’s trough in the second quarter of 2009 to the second quarter 2016, real (inflation-adjusted) GDP increased 15.5 percent, or an average of 2.1 percent per year at a compound annual growth rate.
But that growth has been showing some signs of weakness over the past several quarters. A relatively strong showing in 2014, up 2.5 percent from the fourth quarter of 2013 to the fourth quarter of 2014, was followed by an acceptable, but notably weaker performance in 2015—up 1.9 percent from fourth quarter to fourth quarter. Further, the fourth quarter of 2015 and the first quarter of 2016 fell below 1 percent growth at an annual rate (0.9 percent and 0.8 percent, respectively) and the second quarter of 2016 was only a bit higher than 1 percent (1.2 percent).
Real construction spending (residential and nonresidential) has been even more volatile. Over the same period in 2014 (fourth quarter to fourth quarter) real investment in structures surged 7 percent. But in 2015 it advanced by a more moderate 2.6 percent. In the fourth quarter of 2015 it fell 1 percent (at an annualized rate), but then rebounded 4.5 percent in the first quarter of 2016, only to plunge 6.9 percent in the second quarter.
Real value added from construction—a more restrictive definition than investment in residential and nonresidential structures as previously noted—has had a different trajectory. Note that the value added from construction is for private construction. Although that captures much of construction—even government projects largely use private construction companies—it does exclude work done by government construction workers, which may include military personnel and employees, such as the U.S. Army Corps of Engineers. Also, revisions to the value-added numbers lag behind the release of the GDP numbers.
From the fourth quarter of 2013 to the fourth quarter of 2014, real value added from private construction rose two percent. From the fourth quarter of 2014 to the fourth quarter of 2015 it was up 6.4 percent. On a quarterly annualized basis, it was up 7.6 percent in the fourth quarter of 2015 and up nine percent in the first quarter of 2016 (second quarter data on a comparable basis are not available yet).
Areas of nonresidential construction that did well in 2015 included lodging, office and manufacturing. All of these sectors also performed well in 2014.
Manufacturing construction was largely propelled by investment in energy related projects. However, with the downturn in the energy sector due to lower prices, investment in that sector has plummeted and pulled down the overall manufacturing construction spending numbers. The rise of the foreign exchange value of the dollar (which has hurt exports), relatively slow growth in demand, uncertainty about the economic outlook fueled by the question of when the Federal Reserve will raise interest rates and the presidential election process have all acted as an additional drag on the willingness of manufacturers to make investments.
Construction of commercial projects (mainly retail) was strong in 2014. Growth continued, but slowed significantly in 2015.
Construction on communication projects fell in 2014 but surged in 2015.
Construction of new residential buildings remains strong. Multifamily construction has returned to normal. The still-prevalent fear of owning among many, along with relatively tight mortgage lending standards, acts as a drag on demand for single-family housing. Many builders, mostly small builders, also find it difficult to obtain financing, have few developed lots to work with and have difficulty finding sufficient skilled labor. All of these factors limit builders’ ability to provide new homes at a price buyers are willing to pay. Nonetheless, single-family housing construction activity has been and remains strong, although working off a fairly low base, not having fully recovered from the housing recession. Overall, single-family construction is still well below the nation’s long-term, ongoing needs. On a positive note, this leaves significant room for growth without creating a new housing bubble.
Although inflation has increased a bit over the past year, overall it remains subdued. While some construction materials prices have increased faster than general inflation, these cost increases have been offset by lower prices for energy and related products (e.g., asphalt) and declines in copper prices. Energy prices remain well below their year-ago levels. Steel prices are also down, though to a lesser extent.
Energy prices are likely to remain around their current levels for the rest of this year and well into 2017. Increases in energy and building materials prices will generally be the result of improved economic activity in the United States and abroad. The positives from these increases will outweigh the negative impact from higher input prices for the construction industry as a whole.
Lower energy prices have slowed investment in exploration and new production for oil and natural gas. This has adversely affected equipment suppliers to these industries and investment in other energy-related industries.
Lower energy prices have benefited many manufacturers and aided consumers’ budgets. Initially, consumers used the reduced spending on energy to bolster their savings. But consumers have been increasing their spending for a while now—a definite positive for the economy.
Another positive is the steady advance in employment despite some swings in the monthly numbers. For the first half of 2016, nonfarm payroll employment increased an average of 175,000 jobs per month. Over the three months ending in July, it averaged 190,000 jobs per month. Further, compensation for workers has been on the rise in recent months. This has meant increased income for the employed. An improving job market also makes it easier for workers to find a higher paying job and moves the unemployed into employment, raising the income of the newly employed.
These individuals and their families spend more, creating a virtuous cycle. The healthier job market, increased income and implicit greater job security encourages some households to move ahead with plans to purchase their first house or to move to a more expensive house. A small, but increasing, percentage of these households will purchase a newly constructed house, bolstering demand for single-family residential construction.
The healthier job market also spurs demand for rental properties as the newly employed and those with increased income move out of shared living arrangements. This will sustain the current level (and within reason, a higher level) of multifamily construction. Rising rents are helping keep these new multifamily projects profitable. If there is any area of concern in the multifamily universe, it is that too many high-end luxury multifamily projects concentrated in major cities are moving forward at the expense of more affordable units where most of the demand growth is concentrated. To date, the market has been able to absorb the new units. The aging of units does move some units into a lower, more affordable rent range.
Expect single-family construction to increase this year and to accelerate in 2017. Single-family construction will post healthy percentage gains, but this is still from a relatively low base. Thus, single-family construction will remain below the nation’s long-term needs.
Multifamily construction will continue to rise this year, though at a somewhat slower pace than in 2015. Multifamily construction will largely flatten out in 2017.
Outlook for Government Infrastructure Projects
Politicians have been talking about the pressing need for investment in U.S. infrastructure for well over a year. Yet little has been done to carry out these promises to meet these needs. Opposition to raising taxes, even for badly needed infrastructure projects, remains strong. Public-private partnerships have partially filled the gap. Despite both current presidential candidates endorsing large investments in infrastructure, until the politicians resolve their major differences, little is likely to change.
One of the issues that continues to vex our representatives is providing funding for the Highway Trust Fund (HTF). The HTF is mainly funded by the gas tax, which has not been raised in over 20 years. Occasionally Congress transfers funds to the HTF. Attempts to raise the gas tax have gone nowhere, and more efficient cars have made funding the HTF through this tax more problematic.
Several states have experimented with different ways to raise money for highway construction. Ultimately, these experiments may provide the road map to solving this problem. However, it could be a long time before a solution is reached at the federal level.
The nation’s infrastructure problems are not confined to highways and bridges but include everything from our power grid to water systems. Although the private sector can be expected to invest in some of this infrastructure, the outlook for government investment in infrastructure is bleak at this point. Total investment in infrastructure is on the path to be essentially flat this year and only advance somewhat faster than inflation next year.
Risks to the Forecast
The United States economy continues to trudge along despite various stumbling blocks that keep being thrown in its path. Recent weakness in the GDP numbers are troublesome, but other indicators such as employment and consumer spending suggest a healthier economy. Expect the U.S. economy to move forward at its now familiar slow, but steady, pace. Nonetheless, it must be recognized that there is more uncertainty and increased risk in the current environment. Here are the major risks to this somewhat positive economic forecast.
- Brexit has become the great new unknown. So far it has not had a large effect on the U.S. or world economy beyond the UK. The major fallout to date has been a sharp reduction in the foreign exchange (FX) value of the British pound and a rise in the FX value of the dollar. The dollar’s rise has had an adverse impact on U.S. exports. Agriculture and manufacturing have been hurt the most by this. Brexit is likely to play out over at least the next two years. Next year is when the likely consequences of Brexit will become clearer. Those consequences could be an unexpected negative for the world and U.S. economies.
- A slower growing Chinese economy is another negative and risk for both the U.S. and global economies. China is clearly struggling with various economic problems. China controls its economic data with little transparency and there are always questions about the accuracy of its economic numbers. As with Europe, U.S. exports to China are significant and have been adversely affected. The full impact of economic developments in China remains a risk to U.S. growth forecasts.
- Energy prices, as always, can move sharply in either direction over a short period of time, causing disruptions in the economy. At this point, an upward movement in prices is more likely, but volatility remains a constant.
- The Federal Reserve is expected to raise interest rates once more before year-end. Given that the markets anticipate this move, the impact on financial markets and economic activity is likely to be minor. If the economy continues to show strength, expect to see three to four more quarter point increases in the target federal funds rate next year. However, should the Fed increase rates rapidly over a relatively short period of time, as opposed to its current indication of slow, limited increases, the economy would be severely negatively affected. The probability of this outcome is low.
