January Construction Unemployment Rates Improve in 43 States from 2015
By Bernard M. Markstein, Ph.D.
Overview
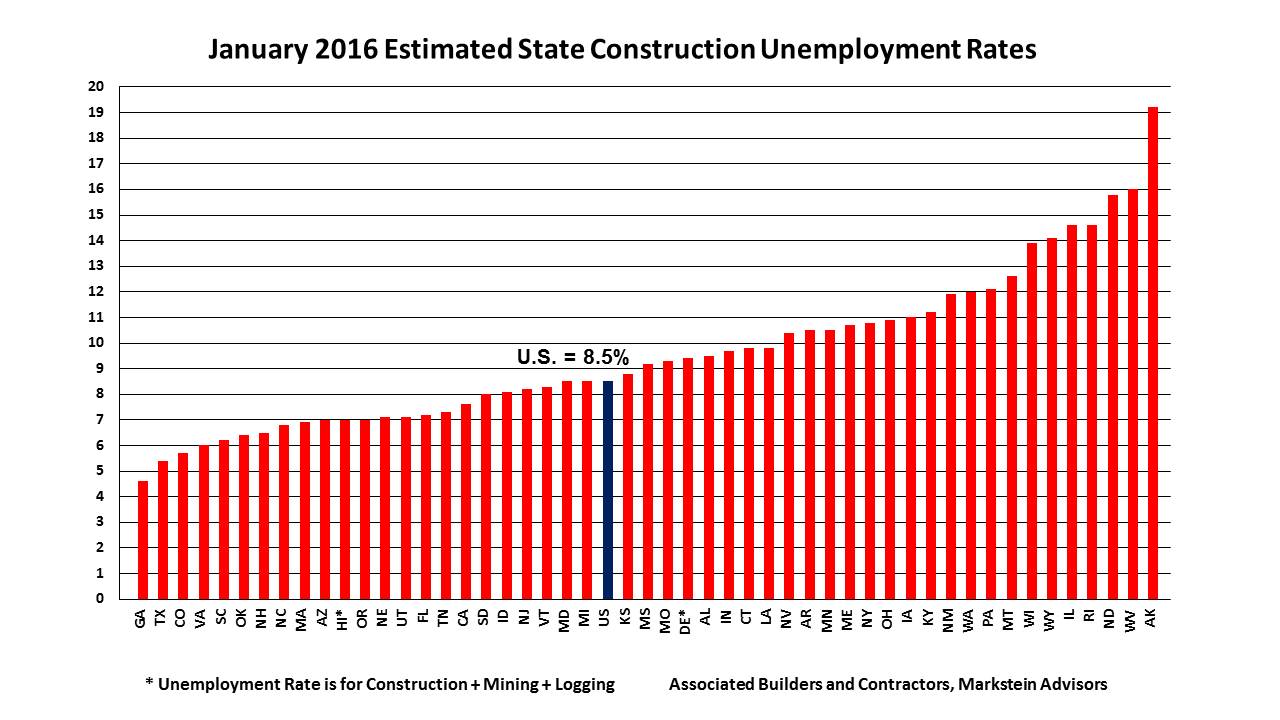
Unusually mild weather in much of the country continued into the first part of January but ended for the East near the end of the month with the brutal storm dubbed “Snowzilla.” The storm did not hit until after the reference week used for surveying employment and unemployment. This undoubtedly helped to temper the normal rise in the not seasonally adjusted (NSA) construction unemployment rates for the nation, which rose from a relatively low December rate of 7.5 percent to 8.5 percent in January. This is the lowest January national construction unemployment rate going back to the beginning of the series in January 2000.
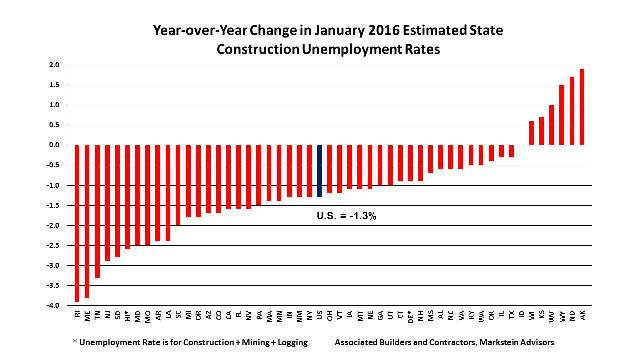
As a result of the relatively good weather and continued improvement in the economy and the construction industry, NSA construction unemployment rates for the country and 43 states were lower than in January 2015. The construction unemployment rate for Idaho was unchanged from a year ago, leaving only six states (Alaska, Kansas, North Dakota, West Virginia, Wisconsin, and Wyoming) with higher year-over-year unemployment rates.
On a year-over-year basis, January national NSA employment in construction increased by 257,000. Further, the national NSA construction unemployment rate has been down on a year-over-year basis each month for over five years running. The U.S. rate was 1.3 percent lower in January 2016 from a year ago.
Note that the NSA unemployment rates have a seasonal pattern with the national NSA construction unemployment rate increasing from December to January.
View states ranked by their construction unemployment rate.
View states ranked by their year-over-year improvement in construction employment.
View each states' unemployment rate for all industries.
The Top Five States
The five states with the lowest construction unemployment rates in January in order from lowest rate to highest were:
1. Georgia
2. Texas
3. Colorado
4. Virginia
5. South Carolina
Three states—Colorado, Georgia, and Virginia—were among the top five in December. Texas would have been the fourth repeat state, but data revisions lowered Hawaii’s rate (which is for construction, mining and logging combined), pushing Texas out of fifth place into sixth place in December. Hawaii had the tenth highest rate in January (7 percent) along with Arizona.
Except for Colorado, these are southern states that tend to have better weather in January than many other states in the country. Also, these are states generally performing well economically.
Georgia, with a 4.6 percent estimated construction unemployment rate, had the lowest rate for the second month in a row. Its December ranking is based on revised data (previously reported as the second lowest rate).
Texas jumped to second lowest from sixth lowest in December based on revised data (previously reported as the fifth lowest rate) with a 5.4 percent construction unemployment rate. Although construction in Houston languishes due to low energy prices, Dallas, which is less dependent on the energy industry, is experiencing a construction boom.
Colorado slipped from the second lowest construction unemployment rate in December based on revised data (previously reported as the lowest rate) to third lowest in January with an estimated 5.7 percent rate.
Virginia declined to fourth lowest with a 6 percent rate from third lowest rate in December. New Hampshire, which had tied with Virginia for third place based on revised data (previously reported as the fourth lowest rate) dropped to seventh lowest rate in January with a 6.5 percent construction unemployment rate.
South Carolina’s construction unemployment rate held steady from December at 6.2 percent. This was enough to catapult the state from 14th lowest rate in December to fifth lowest rate in January.
Hawaii, which had the fifth lowest rate in December based on revised data (previously reported as the sixth lowest rate), had a 7 percent rate in January, which tied with Arizona and Oregon for the tenth lowest rate. There has been a notable drop in the number of building permits issued in Hawaii (both residential and nonresidential) over the past few months.
View the top five and bottom five states ranked by construction unemployment rate.
View states ranked by their monthly improvement in construction employment.
The Bottom Five States
The five states with the highest construction unemployment rates (from lowest to highest) were:
46. Illinois and Rhode Island (tie)
48. North Dakota
49. West Virginia
50. Alaska
Only two of the five states with the highest estimated construction unemployment rates in January—Alaska and North Dakota—were among the five highest in December.
Given the time of year and that these are NSA rates, it should come as no surprise that Alaska with a 19.2 percent rate had the highest rate for the fifth month in a row. Alaska’s January rate was below the state’s January average rate of 22.6 percent from 2001 through 2015. Still, this January’s rate was 1.9 percent higher than last year’s 17.3 percent rate. That was the highest year-over-year increase among the states. However, the 2015 rate is the lowest estimated January rate for Alaska since 2001 (as far back as the January estimates go).
West Virginia had the second highest rate with a 16 percent construction unemployment rate. In December, West Virginia had the seventh highest rate. The state had the fourth largest December year-over-year increase in its rate (1 percent) and the largest monthly increase (5.2 percent).
North Dakota posted the third highest construction unemployment rate with a 15.8 percent rate in January. That was a slight improvement from the second highest rate in December based on revised data (previously reported as the third highest rate). The state also had the second highest year-over-year increase (1.7 percent).
Illinois and Rhode Island tied for the fourth highest rate in January with a 14.6 percent construction unemployment rate. Illinois had the sixth highest rate in December based on revised data (previously reported as the fifth highest rate). Rhode Island had the ninth highest rate in December. However, the state’s 3.9 percent rate drop from January 2015 was the biggest year-over-year decline among the states even as it had the second largest monthly increase (up 4.3 percent).
View regional breakdowns of the construction unemployment rates of each state.
Note
On March 14, the Bureau of Labor Statistics (BLS) released its benchmark revisions of state employment data covering the period from April 2014 through December 2015 (some data prior to April 2014 were also revised). The models used to estimate state construction unemployment rates were updated incorporating the new data. This resulted in some changes to the previously estimated state unemployment rates.
States with small construction workforces tended to have the largest revisions in some months. For example, North Dakota had a significantly lower unemployment rate (down 3 percent) in October 2014 and a significantly higher unemployment rate (up 3.1 percent in February 2015) with the new estimates.
With the release of the benchmark revisions, BLS also provided construction-specific employment data for three states—Maryland, South Dakota and Tennessee. Previously, there were only estimates of unemployment rates for construction, mining and logging combined. This remains the case for two states—Delaware and Hawaii. Also, since BLS only released construction employment data from January 2014 forward for Tennessee, a construction unemployment rate for the state is only estimated starting in January 2014. Prior to that period, an unemployment rate for construction, mining and logging combined was estimated.
Here are tables with estimates of monthly 2014 and 2015 construction unemployment rates for each state using the data and the models prior to the benchmark revisions (December 2015 estimates) and using the revised data and models following the benchmark revisions (January 2016 estimates). Here is a table comparing the difference between the new and old estimates (after revisions minus prior to revisions).
To better understand the basis for calculating unemployment rates and what they measure, see the article Background on State Construction Unemployment Rates.
Overview
Unusually mild weather in much of the country continued into the first part of January but ended for the East near the end of the month with the brutal storm dubbed “Snowzilla.” The storm did not hit until after the reference week used for surveying employment and unemployment. This undoubtedly helped to temper the normal rise in the not seasonally adjusted (NSA) construction unemployment rates for the nation, which rose from a relatively low December rate of 7.5 percent to 8.5 percent in January. This is the lowest January national construction unemployment rate going back to the beginning of the series in January 2000.
As a result of the relatively good weather and continued improvement in the economy and the construction industry, NSA construction unemployment rates for the country and 43 states were lower than in January 2015. The construction unemployment rate for Idaho was unchanged from a year ago, leaving only six states (Alaska, Kansas, North Dakota, West Virginia, Wisconsin, and Wyoming) with higher year-over-year unemployment rates.
On a year-over-year basis, January national NSA employment in construction increased by 257,000. Further, the national NSA construction unemployment rate has been down on a year-over-year basis each month for over five years running. The U.S. rate was 1.3 percent lower in January 2016 from a year ago.
Note that the NSA unemployment rates have a seasonal pattern with the national NSA construction unemployment rate increasing from December to January.
View states ranked by their construction unemployment rate.
View states ranked by their year-over-year improvement in construction employment.
View each states' unemployment rate for all industries.
The Top Five States
The five states with the lowest construction unemployment rates in January in order from lowest rate to highest were:
1. Georgia
2. Texas
3. Colorado
4. Virginia
5. South Carolina
Three states—Colorado, Georgia, and Virginia—were among the top five in December. Texas would have been the fourth repeat state, but data revisions lowered Hawaii’s rate (which is for construction, mining and logging combined), pushing Texas out of fifth place into sixth place in December. Hawaii had the tenth highest rate in January (7 percent) along with Arizona.
Except for Colorado, these are southern states that tend to have better weather in January than many other states in the country. Also, these are states generally performing well economically.
Georgia, with a 4.6 percent estimated construction unemployment rate, had the lowest rate for the second month in a row. Its December ranking is based on revised data (previously reported as the second lowest rate).
Texas jumped to second lowest from sixth lowest in December based on revised data (previously reported as the fifth lowest rate) with a 5.4 percent construction unemployment rate. Although construction in Houston languishes due to low energy prices, Dallas, which is less dependent on the energy industry, is experiencing a construction boom.
Colorado slipped from the second lowest construction unemployment rate in December based on revised data (previously reported as the lowest rate) to third lowest in January with an estimated 5.7 percent rate.
Virginia declined to fourth lowest with a 6 percent rate from third lowest rate in December. New Hampshire, which had tied with Virginia for third place based on revised data (previously reported as the fourth lowest rate) dropped to seventh lowest rate in January with a 6.5 percent construction unemployment rate.
South Carolina’s construction unemployment rate held steady from December at 6.2 percent. This was enough to catapult the state from 14th lowest rate in December to fifth lowest rate in January.
Hawaii, which had the fifth lowest rate in December based on revised data (previously reported as the sixth lowest rate), had a 7 percent rate in January, which tied with Arizona and Oregon for the tenth lowest rate. There has been a notable drop in the number of building permits issued in Hawaii (both residential and nonresidential) over the past few months.
View the top five and bottom five states ranked by construction unemployment rate.
View states ranked by their monthly improvement in construction employment.
The Bottom Five States
The five states with the highest construction unemployment rates (from lowest to highest) were:
46. Illinois and Rhode Island (tie)
48. North Dakota
49. West Virginia
50. Alaska
Only two of the five states with the highest estimated construction unemployment rates in January—Alaska and North Dakota—were among the five highest in December.
Given the time of year and that these are NSA rates, it should come as no surprise that Alaska with a 19.2 percent rate had the highest rate for the fifth month in a row. Alaska’s January rate was below the state’s January average rate of 22.6 percent from 2001 through 2015. Still, this January’s rate was 1.9 percent higher than last year’s 17.3 percent rate. That was the highest year-over-year increase among the states. However, the 2015 rate is the lowest estimated January rate for Alaska since 2001 (as far back as the January estimates go).
West Virginia had the second highest rate with a 16 percent construction unemployment rate. In December, West Virginia had the seventh highest rate. The state had the fourth largest December year-over-year increase in its rate (1 percent) and the largest monthly increase (5.2 percent).
North Dakota posted the third highest construction unemployment rate with a 15.8 percent rate in January. That was a slight improvement from the second highest rate in December based on revised data (previously reported as the third highest rate). The state also had the second highest year-over-year increase (1.7 percent).
Illinois and Rhode Island tied for the fourth highest rate in January with a 14.6 percent construction unemployment rate. Illinois had the sixth highest rate in December based on revised data (previously reported as the fifth highest rate). Rhode Island had the ninth highest rate in December. However, the state’s 3.9 percent rate drop from January 2015 was the biggest year-over-year decline among the states even as it had the second largest monthly increase (up 4.3 percent).
View regional breakdowns of the construction unemployment rates of each state.
Note
On March 14, the Bureau of Labor Statistics (BLS) released its benchmark revisions of state employment data covering the period from April 2014 through December 2015 (some data prior to April 2014 were also revised). The models used to estimate state construction unemployment rates were updated incorporating the new data. This resulted in some changes to the previously estimated state unemployment rates.
States with small construction workforces tended to have the largest revisions in some months. For example, North Dakota had a significantly lower unemployment rate (down 3 percent) in October 2014 and a significantly higher unemployment rate (up 3.1 percent in February 2015) with the new estimates.
With the release of the benchmark revisions, BLS also provided construction-specific employment data for three states—Maryland, South Dakota and Tennessee. Previously, there were only estimates of unemployment rates for construction, mining and logging combined. This remains the case for two states—Delaware and Hawaii. Also, since BLS only released construction employment data from January 2014 forward for Tennessee, a construction unemployment rate for the state is only estimated starting in January 2014. Prior to that period, an unemployment rate for construction, mining and logging combined was estimated.
Here are tables with estimates of monthly 2014 and 2015 construction unemployment rates for each state using the data and the models prior to the benchmark revisions (December 2015 estimates) and using the revised data and models following the benchmark revisions (January 2016 estimates). Here is a table comparing the difference between the new and old estimates (after revisions minus prior to revisions).
To better understand the basis for calculating unemployment rates and what they measure, see the article Background on State Construction Unemployment Rates.