ABC's Construction Backlog Indicator 'Returns to Earth' in Second Quarter
WASHINGTON, Oct. 18—Associated Builders and Contractors (ABC) today reported its Construction Backlog Indicator (CBI) fell to 8.6 months during the second quarter of 2017, down 4.1 percent from the first quarter of 2017. CBI is up by 0.1 months, or 1.4 percent, on a year-over-year basis.
“Construction backlog was bound to return to Earth in the second quarter,” said ABC Chief Economist Anirban Basu. “The first quarter of 2017 saw growing backlog for each and every region, industry and company size, which had never occurred in the eight-year history of the series. It should not be viewed as a surprise that backlog shortened modestly in the second quarter.
“Some contractors had hinted that backlog may become a bit more erratic after the first quarter due to a combination of growing concerns regarding overbuilding in certain sub-markets in certain cities and weak public construction spending in much of the nation,” said Basu. “Still, backlog data remains elevated by historic standards and remains above its year-ago level. The primary implication is that the construction recovery cycle has not yet begun to wind down in earnest.
“With interest rates remaining low, U.S. and global economies improving and plentiful capital available, private construction activity should remain formidable. However, public construction continues to languish, which has placed a ceiling on backlog throughout the current cycle.”
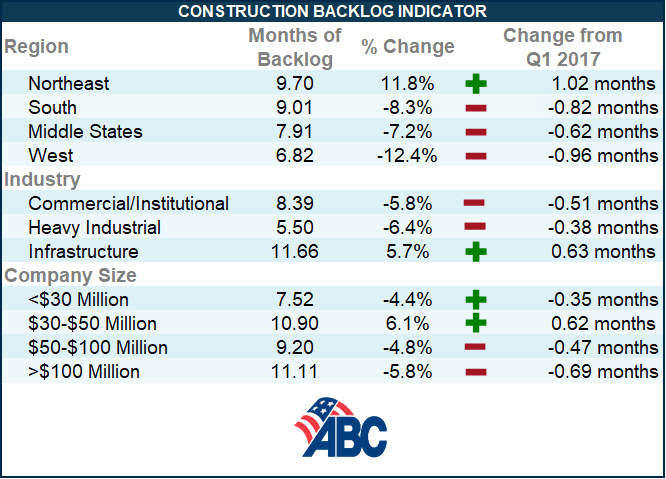
Highlights by Region
⦁ The healthy performance of private construction markets in New York, Boston and other East Coast markets has helped push Northeast backlog to 9.7 months, the longest backlog of any region. The second quarter of 2017 represents the first time since the fourth quarter of 2014 that the South has not reported the longest backlog of any region.
⦁ During the first quarter, backlog in the West was up by a remarkable 26 percent, setting the stage for some reversion during the second. Backlog in the West now stands at 6.8 months, the shortest of any region. That is somewhat surprising given the rapid growth that continues to characterize Denver, Seattle, Phoenix, Las Vegas and other hotspots. This may be a reflection of the fierce competition among construction firms in the West, where intense competition has the effect of limiting average backlog per firm.
⦁ Backlog in the Middle States remains stable and is roughly unchanged on a year-ago basis. Stable commodity prices have helped.
⦁ Backlog in the South is meaningfully lower than it was a year ago despite ongoing elevated levels of activity in Atlanta and in several Florida markets. It will be interesting to see how recent hurricanes impact backlog, whether for better or for worse.
.jpg)
Highlights by Industry
⦁ Backlog in the commercial/institutional segment slipped to 8.4 months during the second quarter, but that still represents the second highest level for the indicator since the fourth quarter of 2014. The implication is that private commercial construction will remain robust for the foreseeable future.
⦁ Average backlog in the heavy industrial category fell to 5.5 months during the second quarter, meaningfully lower on both quarterly and annual bases. There have been many forces at work, including slowing auto sales, downward pressure on prices in a number of key manufacturing segments and soft exports. Recent weakening of the U.S. dollar should stimulate exports, which should eventually translate into longer heavy industrial backlog.
⦁ Backlog in the infrastructure category expanded during the second quarter to 11.7 months, the second highest reading on record. That is particularly interesting given that Census Bureau data continue to indicate that infrastructure spending remains weak and many categories remain in decline. It may be that a significant number of firms have left the industry or been acquired over time, leading to fewer players, which is associated with longer average backlog.
Highlights by Company Size
⦁ Backlog at large firms—those with annual revenues in excess of $100 million—remained above 11 months during the second quarter of 2017. These firms are disproportionately engaged in infrastructure, the industry category associated with the lengthiest average backlog. There has been a wave of consolidation among large construction and engineering firms in recent quarters, which may be stabilizing average backlog in this group.
⦁ Backlog at firms with annual revenues between $50 million and $100 million remained longer than 9 months for the fourth straight quarter. This is a group weighted heavily toward commercial construction firms, which have continued to benefit from the construction of a large number of hotel rooms, office buildings and fulfillment centers.
⦁ Backlog among firms with between $30 million and $50 million in annual revenues rose to 10.9 months during the second quarter, the third highest reading on record. As the construction recovery has broadened, more of these contractors have been busy, in part because larger firms are no longer able to accept all available work.
⦁ Backlog for firms with annual revenues of less than $30 million remains remarkably stable at 7.5 months. Backlog for this group has been between 7.2 and 8.1 months for eleven consecutive quarters, a reasonably healthy level.
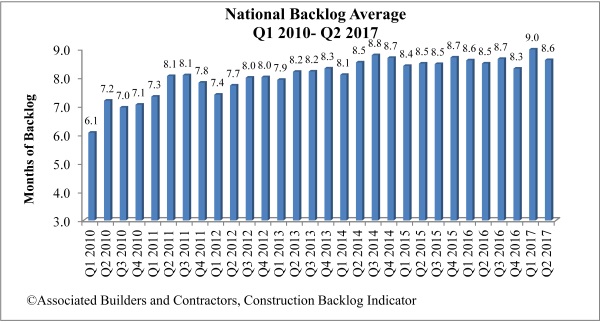
CBI is a leading economic indicator that reflects the amount of construction work under contract, but not yet completed. CBI is measured in months, with a lengthening backlog implying expanding demand for construction services. More charts and graphs are available on abc.org.
Note: The reference months for the Construction Backlog Indicator and Construction Confidence Index data series were revised on May 12, 2020. All previously reported quarters and months shifted forward by one period to better reflect the timing of when the surveys were conducted.