Construction Backlog Expands Nearly 3 Percent at the Close of 2015
WASHINGTON, D.C., March 22 – The South posted the highest backlog in the history of the Construction Backlog Indicator (CBI) in the fourth quarter of 2015, according to Associated Builders and Contractors (ABC).
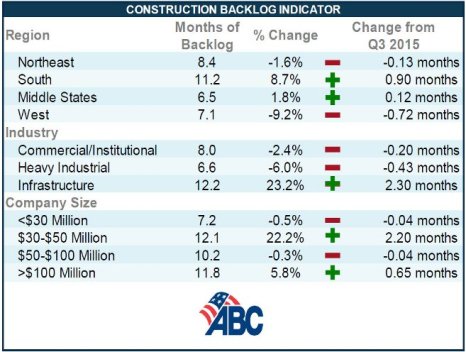
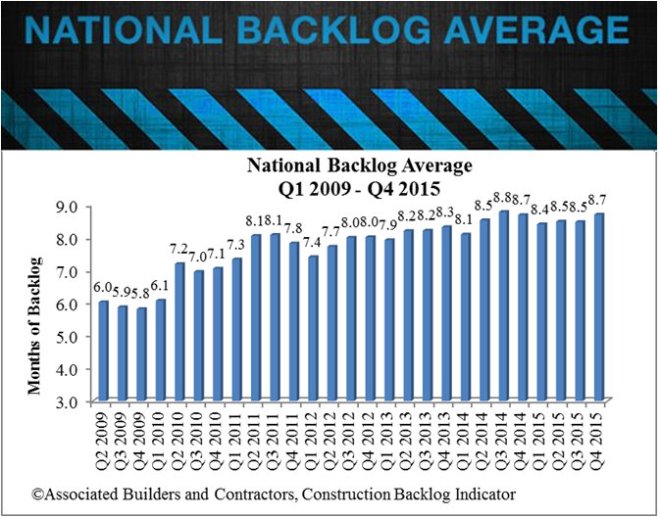
Nationally, backlog expanded by 2.7 percent to 8.7 months in the last three months of the year, with the South expanding on its previous record high reading by 8.7 percent to 11.19 months. In addition, infrastructure-related backlog expanded by 23.2 percent in the fourth quarter to 12.2 months.
“For the first time in years, some contractors are reporting that they are turning away work,” said ABC Chief Economist Anirban Basu. “Skill-worker shortages are a frequently cited reason. The recent uptick in backlog suggests that demand for construction workers will remain elevated going forward, which will translate into faster wage growth, but also potentially rising costs and extended timelines.
“The nonresidential construction recovery remains very much in place,” said Basu. “Despite disappointing news regarding global growth and corporate earnings, most contractors reported steady to rising backlog during 2015’s final weeks. That’s important to contractors, of course, but also to other economic stakeholders, since nonresidential construction spending growth has emerged as one of the nation’s leading economic drivers.
“Nonresidential construction spending growth in January of 2016 was fully 12.3 percent its year-ago level,” said Basu. “However, there were a number of months during the latter half of 2015 during which construction spending growth was soft. Accordingly, backlog expanded less rapidly during that period, including during the quarters that precede the fourth quarter’s expansion.”
See charts and graphs
Regional Readings
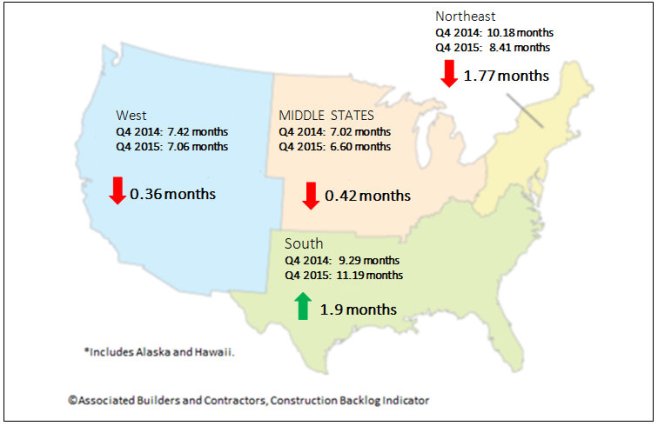
The South once again recorded the lengthiest backlog among four regions. The region’s backlog expanded to 11.2 months, an 8.7 percent increase from the previous quarter. There is evidence that the recently passed federal highway bill is already inducing state department of transportation leaders to move forward with previously sidelined projects. The South is also associated with the nation’s fastest population growth, and therefore tends to experience faster growth in both residential and commercial construction.
Backlog in the Middle States also expanded, though less dramatically. While energy production has softened in a number of states, there is evidence that manufacturing activity has begun to stabilize. The auto sector continues to drive industrial work and healthcare-related construction remains active.
Regional Highlights
- After a lull in backlog growth in Louisiana, several Louisiana contractors are reporting significant surges in backlog more recently. Louisiana is one of the nation’s leading oil and natural gas suppliers. Some analysts have indicated that the state has been at risk of recession. But the ongoing expansion of the petrochemical sector as helped to rebuild backlog. Commercial activity has also begun to rebound in many communities.
- Backlog remains steady in the Northeast. The region has benefitted from stabilized federal government outlays, improving fiscal conditions in a handful of states and brisk commercial activity that is often linked to multifamily construction.
- Backlog in the West slipped during the year’s initial quarter. There has been much speculation regarding excessively high technology company valuations. Many tech companies have expanded their physical capacity in recent years, and evidence suggests that this pace of expansion may have slowed somewhat. Still, backlog in the West remains above its level in the first half of 2015.
Fourth Quarter 2014 v. Fourth Quarter 2015
Industry Breakdown
During the third quarter of 2015, backlog expanded in each of the three industry categories monitored by ABC—commercial/institutional, heavy industrial, and infrastructure. Despite the overall growth in backlog, the same cannot be said of the fourth quarter. In fact, one category drove all of the increase in backlog—infrastructure. This is a key finding as many industry participants have wondered how long it would take before the recently passed federal highway bill had an impact. It turns out that impact is already being felt as projects are being bid out in large numbers, allowing infrastructure contractors to add quickly to their respective backlog.
Industry Highlights
- Backlog in the infrastructure category has reached an all-time high of 12.2 months. During the fourth quarter, backlog in this category increased by 2.3 months, a remarkable result and indicative of the quick impact of the newly passed federal highway spending bill – the first such bill to be passed in many years.
- Backlog in the heavy industrial category stands at 6.64 months, 6 percent lower than during the third quarter of 2015. This comes as little surprise as the nation’s manufacturing sector sustained a 6 percent dip in exports last year. Additionally, the strong U.S. dollar has rendered imports more price competitive, suppressing domestic profit margins and construction.
- Backlog in the commercial/institutional category stands at more than 8 months. Backlog in this segment has stood at 8 months or better for 14 consecutive months, a reflection of the ongoing gradual economic recovery.
Company Size Trends
Along the dimension of firm size, two groups seem to be benefiting disproportionately from the ongoing nonresidential construction market recovery – large general contractors and large subcontractors. That may help explain why the two categories reporting the lengthiest backlog are the $30 million to $50 million annual revenue level, which includes many large subcontractors, and the $100 million or more revenue level, which includes many general contractors.
Highlights by Company Size
- Backlog in the $30 million to $50 million annual revenue category now exceeds 12 months, the highest level in the history of this series. By contrast, average backlog during the fourth quarter of 2009 (six years ago) stood at 5.5 months.
- Backlog among the largest construction firms in the survey (+$100 million) expanded to 11.8 months during 2015’s final quarter, the second highest level in the history of the series.
- Backlog in the $50 million to $100 million annual revenue category remains above 10 months and has been above that threshold during 12 of the last 14 quarters.
- Backlog among the smallest firms in the survey (>$30million) stood at 7.2 months during the four quarter, roughly the same as during the prior quarter. Backlog among this group of firms hardly changed over the course of 2015, though backlog presently is not as elevated on average as it was during in mid-2014.
Note: The reference months for the Construction Backlog Indicator and Construction Confidence Index data series were revised on May 12, 2020. All previously reported quarters and months shifted forward by one period to better reflect the timing of when the surveys were conducted.